Kalshi’s Penny Parlay is the Worst Bet in America — and the Smallest Bettors are Buying it
If you are a fan of Kalshi penny parlays, you are likely throwing away money at a phenomenal rate, according to research by Gambling Insider. The longer the odds and the smaller the bet, the larger the relative loss.

Trade-level data from Kalshi shows that losses on multi-leg bets scale almost perfectly with how long the odds are and how small the stake is. Buyers of sub-2 cent combos lost 92 cents of every dollar; bettors staking under $5 lost three to five times more per dollar than those staking $100 or more.
Put simply, the cheapest ticket on Kalshi is the most expensive bet in America. It may be yet another reason why state regulators appear to be winning the battle to protect their residents from what they deem to be Kalshi’s illegal gambling.
An analysis by Gambling Insider of roughly 325,000 individual parlay purchases on the exchange shows that what a bettor loses per dollar staked is almost entirely determined by two things visible at the moment they tap “submit”: the odds they accept and the size of their stake.

Our analysis examined every “taker” fill in multi-leg combo markets that settled across four days in late July.
Buyers of combos priced below 2 cents, in other words, implied odds of less than one-in-fifty, the “lottery tickets” prominent in the product’s marketing, recovered just 8 cents of every dollar they staked.
Combos bought between 2 and 10 cents lost roughly half the money wagered on them. At the other end of the odds spectrum, combos priced between 35 and 50 cents — near coin-flips, typically two short-priced legs — lost buyers just 2 cents per dollar: essentially a fairly priced product.
The same gradient appears when the dollar amount, rather than the odds, sorts the fills.
Stakes under $1 lost 88 cents per dollar. Stakes of $1 to $5 lost 75 cents. Stakes of $100 or more, whether $100 or $10,000, lost 16 cents.
The two gradients are related, and the relationship is the point: small bettors overwhelmingly buy the longest odds.
Is Kalshi Exploiting ‘Favorite-Longshot Bias’?
On Kalshi’s own data (via Dune), more than half of all combo contracts traded this year — 19.7 billion of 38 billion, or 51.8 percent — were bought below 2 cents of implied probability, yet those contracts account for just 1.4 percent of the dollars wagered: $43 million of $3.19 billion.
The long-shot end of the market is, almost by definition, the small-stakes end.
Buyers of Kalshi’s sub-2-cent combos’ 92¢ loss rate is more than four times the sportsbooks’ 19–21¢ parlay hold and more than double state lotteries’ ~42.5¢ (NASPL national data, FY2025: 57.5% of $109.4bn in sales paid out as prizes).
Bear in mind, though, that state filings don’t break sportsbook parlays out by odds, so the books’ own longest-shot slips may be similarly brutal. Nobody outside their trading rooms knows the truth of the matter, because nothing requires them to show us. Also, Kalshi makes its money on fees, not hold.
Gambling Insider derived the sportsbooks’ 19-21% hold from the New Jersey and Maryland official filings.
Kalshi’s open data is why the number is visible here; based on the evidence available, no legal gambling product in America with published loss rates takes more of the player’s dollar than the penny parlay.
None of this is an accident of a pricing error on any single bet. It is the well-documented “favorite–longshot bias”.
This is the pattern most prevalent in racetrack and lottery data, showing that bettors systematically overpay for small chances (low probability) of large payouts while undervaluing high-probability favorites.
And here we find it expressed at industrial scale on a federally regulated exchange, in a product that did not exist 10 months ago and now trades over $1 billion a month.
Kalshi’s app surfaces multi-leg combos at the top of its sports page, ahead of conventional single-outcome markets. Kalshi combos are almost entirely based on sports markets.
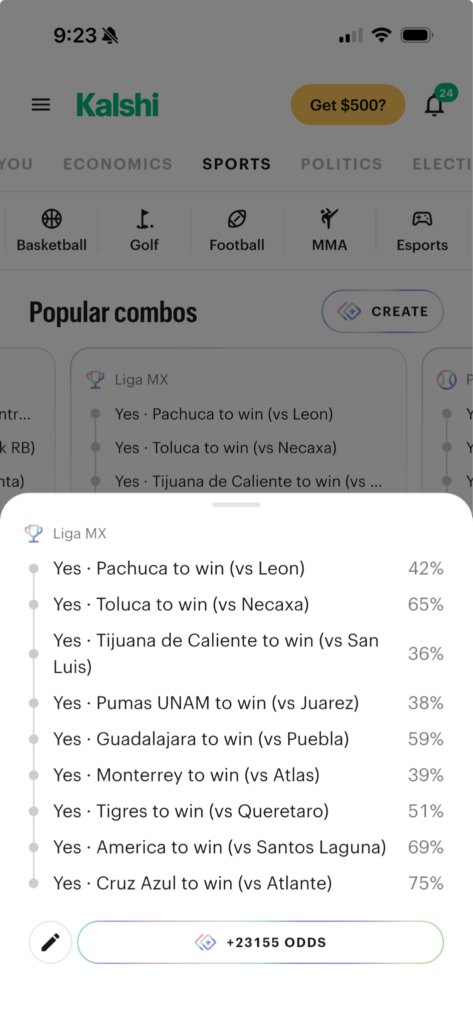
Image: Screenshot of the Kalshi app taken on Thursday, July 30, 2026
The exchange does not set the prices. Competing market makers do that, responding to each customer’s request within about a second. That competition appears to work well where the product resembles a financial instrument: the near-coin flip combos are priced almost fairly.
It works worst precisely where the customers are smallest.
Why are so Many Players Susceptible to ‘Favorite-Longshot Bias’? ‘
I reached out to Eric Zitzewitz, a professor of economics at Dartmouth University, for an explanation of why players are so prone to falling into the mispricing trap.
He pointed me to a paper in the Journal of Political Economy: Vol 118, No 4 by two of his co-authors over the years, Erik Snowberg and Justin Wolfers, entitled “Explaining the Favorite–Long Shot Bias: Is it Risk-Love or Misperceptions?“.
Zitzewitz explains in an email:
They conclude that bettors overpay for longshot parlays because the misperceptions that drive the FV-LS bias basically compound. There are a lot of parlays to choose from, and bettors are likely to choose the ones that combine the events that they have overestimated by the most.”
“On the market maker side, taking the other side of at least some parlays might be more costly than same-odds straight bets, particularly if they involve events that might be correlated.
“For example, if someone wants to bet on the exact order of finish in a harness race, I might not want to take the other side …”
Zitzewitz, Snowberg, and Wolfers have collaborated on many papers related to prediction markets, among the most influential of which was the groundbreaking Partisan Impacts on the Economy: Evidence from Prediction Markets and Close Elections, published in the Quarterly Journal of Economics in 2007.
OK, that makes sense. Let’s move on.
…and Why are parlays so Hard to Price?
I spoke to an expert in the field of betting analytics to get to the bottom of parlay mispricing — the owner of Plus EV Analytics, Matt Buchalter.
The first reason is obvious. “Pricing the combo requires you to first price each individual leg. The more legs, the more potential for error,” Buchalter said in an email.
But things can get complicated fast. “For same-game combos, you also have to price correlations between legs. Those are notoriously difficult to price, and they’re one of the reasons why sportsbooks price higher margins into SGPs [same-game parlays].”
Then there’s the unique aspect of the request-for-quote environment, in which market makers compete to offer the best price to takers.
Buchalter breaks it down:
In an RFQ environment, you are competing against other market makers for the same quote. This makes quoters vulnerable to something called ‘the winner’s curse,’ where there are asymmetric consequences of pricing too high (you just don’t win the bid and your P&L is zero) vs pricing too low (you win the bid at an unfavorable price and potentially lose money).”
But these might all be considered second-order issues compared to the fundamental reason for mispricing: “Most importantly, longshot combos are hard to price for the same reason that longshot singles are hard to price,” Buchalter states. “There’s a larger and larger amount of leverage on mispricing as the implied probability gets closer and closer to zero.
“For example, if something is really 51% and I misprice it at 50%, the edge afforded to my counterparty is 51/50 – 1 = 2% before fees. If something is really 3% and I misprice it at 2%, the edge afforded to my counterparty is 3/2 – 1 = 50% before any fees.”
Buchalter’s math shows us that in the middle of the odds curve, a pricing mistake costs pennies; at the tail, the same mistake multiplies your counterparty’s money.
Longshot combos aren’t just harder to price — every error in them is worth fifty times more to the other side, and our data shows the market charges accordingly: 10x fair value on the cheapest tickets, near-fair on coin-flips.
What’s the Behavioral Psychology Going on Here?
I asked Buchalter why players succumb to longshot bias. “Players ‘succumb to longshot bias’ (your words, not mine) because to most people who gamble for entertainment purposes, their utility tends to come from the possibility of risking a small amount to win a large amount.”
He continues: “Nobody would buy lottery tickets if the ticket cost $5 and the prize was $9, even though the odds of winning in that hypothetical would be much higher. This is a very well-known and widely accepted phenomenon in behavioral psychology.”
Suffice it to say, our central contention in this article falls squarely within the argument the industry is already having.
Market makers on the exchange argue that competition among them gives retail bettors a better deal than the sportsbooks’ take-it-or-leave-it parlay prices — and on the blended numbers, that defense has support [see companion story].
But the blended numbers average the near-fair coin flips bought by large bettors with the deeply unfair lottery tickets bought by small ones.
The product is not a single product. At the top of the odds curve, Kalshi combos are a reasonable financial instrument; at the bottom, where the smallest customers live, they are a lottery with a 92% take rate.
We have reached out to Kalshi for comment, but have not heard back by publication time; we will update this story if we do.
Here’s How Gambling Insider Dug Out and Verified the Kalshi Data
Gambling Insider began by replicating the Bloomberg charts found in this article, which the highly reputable financial news and data house published on July 28.
We worked out how to reproduce the $294 million number (Kalshi bettors “have lost a net $294 million on its combos since the start of the year, excluding fees”) cited in the Bloomberg report, as a verification that our methodology, based on the same assumptions, could be fairly applied to surface other data and findings that the article doesn’t address.
The Bloomberg analysis hangs on one column in Dune’s curated Kalshi data: mve_collection_ticker in kalshi.market_details, which flags a market as a multivariate (combo) market.
Join that to trade-level fills in kalshi.market_trades — which carries taker side, price, notional, taker fee, and settlement result — and the $294 million figure is a single aggregation of taker P&L on settled combos.
Analysis of yes-side (buyer) taker fills on Kalshi’s two multi-leg combo series for markets settling July 22, 24, 25, and 26 , collected via Kalshi’s public API: ~325,000 fills across ~3,200 markets sampled by volume strata (all top-volume markets exact, long tail systematically sampled).
‘Hold’ is net buyer loss divided by amount staked; a fill, not a person, is the unit — one bettor may account for many fills. The 50–80¢ bucket (22¢ hold) is inflated by two favorites-losing days inside the four-day window; the sub-10¢ buckets are stable across days. Figures describe this window, not a season. Contract-distribution figures are exact, from Kalshi’s full trade record on Dune (kalshi.trade_report).
Here’s How You Can Reproduce the Data
The Dune-runnable half (combo flow by price bucket) is published as a public, forkable query at dune.com/queries/8174257 (workbench: dune.com/queries/8139376).
The hold figures require settlement results and taker sides, which Dune’s free tables do not carry; a standalone script reproducing the full API pipeline (census → stratified sample → fills → buckets), plus the chart’s exact aggregate data as CSV, accompanies this story.
Kalshi’s market and trade endpoints are public and keyless.
We built a Python script to take the pain out of all that data-intelligence heavy lifting. The script and the data the charts at the top of the article are based on are available in this package: kalshi_chart1_repro_pack.zip
| Fill size bucket | Yes taker fills | Stake ($) | Payout ($) | Buyer hold (%) |
| under $1 | 63662 | 43165 | 4986 | 88.4 |
| $1-5 | 98072 | 329219 | 81409 | 75.3 |
| $5-20 | 99036 | 1111885 | 442462 | 60.2 |
| $20-100 | 50160 | 2347763 | 1687958 | 28.1 |
| $100-1k | 12617 | 3762385 | 3149138 | 16.3 |
| $1k+ | 822 | 2858756 | 2393373 | 16.3 |
| Entry price bucket | Yes taker fills | Stake ($) | Payout ($) | Buyer hold (%) |
| under 2c | 136871 | 1070644 | 85348 | 92.0 |
| 2-5c | 40829 | 584822 | 284984 | 51.3 |
| 5-10c | 31926 | 681011 | 349650 | 48.7 |
| 10-20c | 27278 | 998316 | 701179 | 29.8 |
| 20-35c | 42970 | 2340129 | 2086516 | 10.8 |
| 35-50c | 25968 | 2117770 | 2073461 | 2.1 |
| 50-80c | 16746 | 2302846 | 1798738 | 21.9 |
| 80c+ | 1781 | 357634 | 379451 | -6.1 |


Gambling Insider delivers the latest industry news, in-depth features, and operator reviews that you can trust. Our team combines rigorous editorial standards with decades of specialized expertise to ensure accuracy and fairness. We are committed to delivering clear, impartial, and dependable coverage across the global gambling sector.