Analysis by region
Source: Company reports
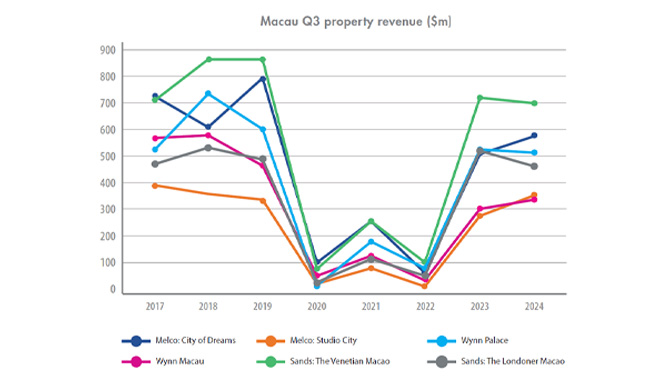
*As they do not report the quarterly revenue of each of their properties, MGM China and Galaxy Entertainment properties have not been listed
– Having faced particularly challenging circumstances during the Covid-19 pandemic, all of the properties in Macau faced significant declines in revenue in 2020 and 2022, with only a light reprieve given in 2021.
– Of the six recorded properties, only Studio City has exceeded pre-pandemic revenue, making $364.7m in Q3 2024 compared to 2019’s $337.7m and 2018’s $345.2m. Both The Venetian Macao and The Londoner Macao are close to bridging the gap, however, with a difference of $10m and $7m respectively between their 2017 and 2024 figures. Wynn Palace is also not far behind, with a $5.2m between its 2017 and 2024 figures.
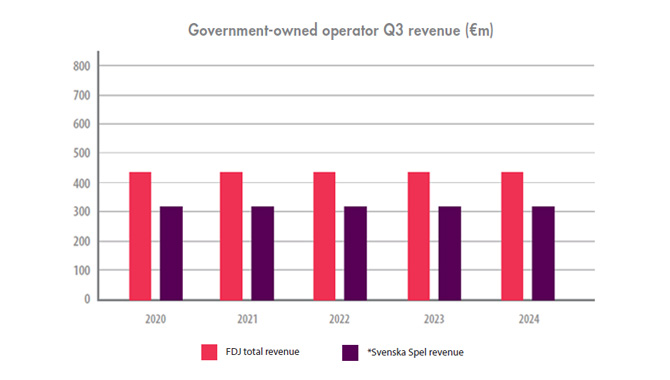
Government-owned operator Q3 revenue in France and Sweden (€m)
Analysis by region
Source: Company reports
*Svenska Spel figures in equivalent SEK to EUR conversion rate as of 11.11.2024
– Aside from a slight dip in 2023, FDJ has reported consistent revenue growth since 2020, from €503m ($528m) to €669m. It may have been this dip in 2023 revenue, in fact, that encouraged the operator to pursue new growth opportunities; namely, its acquisition of Kindred, which was completed in October 2024.
– However, with legalised online gaming on the cards in France for 2025, this continuous rate of growth may face some hurdles. Though, with the French Government’s suggested online gaming tax rate of 55.6%.
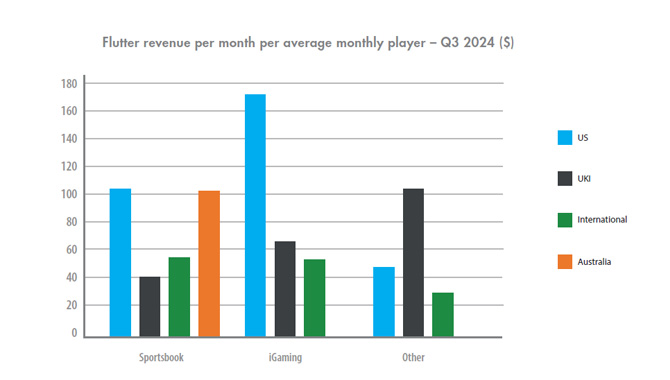
Flutter revenue per month per average monthly player – Q3 2024 ($)
Analysis by region
Source: Flutter Entertainment
– By dividing the revenue from each of Flutter’s verticals and geos by each segment’s average monthly players, then dividing it by three to find average revenue from each month over the quarter, it is clear that US sportsbook and iGaming spending greatly outperforms Flutter’s UK & Ireland (UKI) and International segments, with the average US FanDuel player spending $105.43 on sports betting and $171.08 on iGaming per month – over 160% more than the UKI revenue per average monthly player (AMP).
– Australian and US sports betting revenue per month per average monthly player was relatively similar, with just $2.12 between them. This reflects the betting cultures of these nations, which encourages big spends and big wins (consider the high risk/ high reward glitz and glamour of Las Vegas), while the UK & Ireland holds a betting culture entrenched in smaller bets.
– US iGaming revenue may be as high as it is due to its limited market and potential lack of RG practices, combined with the ease of use of iGaming platforms. Indeed, across the board, all players spent more on iGaming than sports betting.
– Flutter’s other products, which include exchange betting, parimutuel (pool) wagering and daily fantasy sports (DFS), were the highest value bets in the UKI segment, with AMPs in this category spending an average of $107.14 compared to $40.36 on sports betting and $65.80 on iGaming. This is also more than double the average $48.66 spent on this vertical per month per AMP in the US.
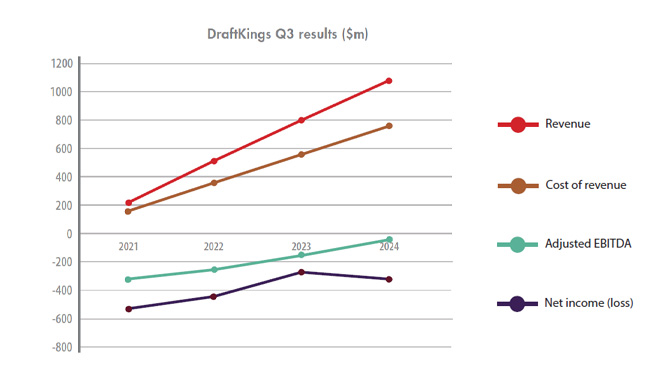
DraftKings Q3 results ($m)
Analysis by region
Source: DraftKings
– DraftKings has yet to see a profitable Q3. This came as a surprise for some, as trends from 2021 – 2023 suggested progression that would push the sportsbook into profitability in Q3 2024. This was supported by the sportsbook’s Q2 2024 results, when it reported a net income of $63.8m. This has been the same for adjusted EBITDA, which has also yet to see a positive Q3 result.
– Year-on-year, net loss increased by $12m in 2024, totaling $298.6m.
– Despite this, revenue growth has been surprisingly consistent, growing by roughly $300m each year since 2021. Specifically, up $289m from 2021 to 2022, $288m from 2022 to 2023 and $305.5m from 2023 to 2024.
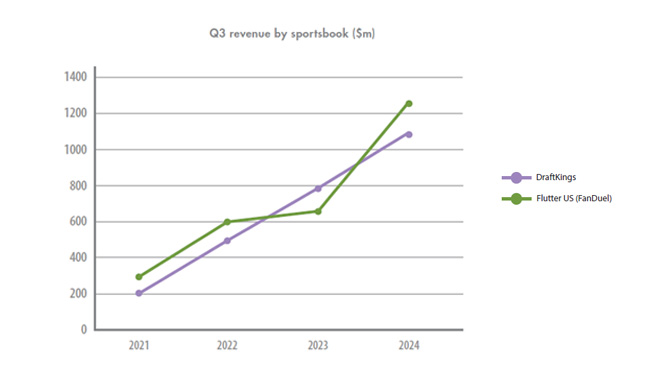
Q3 revenue by sportsbook ($m)
Analysis by region
Source: Company reports
– Comparing DraftKings revenue to revenue reported from Flutter’s US segment, which primarily consists of the work done by its US sportsbook brand, FanDuel, it shows that, despite a lull between 2022 and 2023 – one that resulted in DraftKings outperforming FanDuel in Q3 revenue, FanDuel has been able to claw back a victory, making $1.25bn in Q3 2024 compared to DraftKings’ $1.1bn.
– While DraftKings has shown better consistency in revenue growth year-on-year, FanDuel has reported the sharpest inclines in revenue. Between 2023 and 2024, for example, FanDuel revenue grew 51%, while DraftKings grew 39% year-on-year.
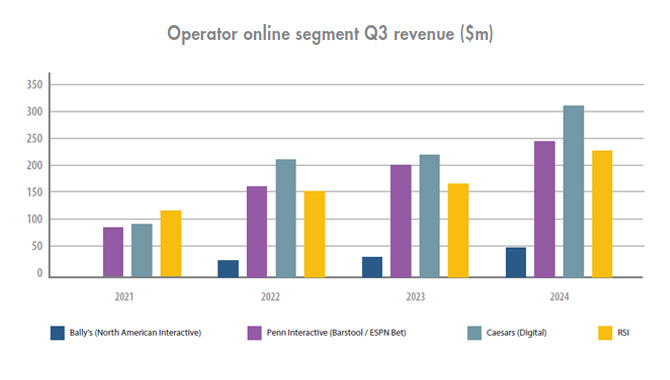
Operator online segment Q3 revenue ($m)
Analysis by region
Source: Company reports
– Bally’s only began reporting the revenue of its North America Interactive segment in 2022. Of the four, it is the lowest earner by a significant margin — however it has shown steady growth year-on-year.
– While RSI led the online operator segment in 2021, by 2023 it was being outperformed by both Penn and Caesars – a trend that continued into 2024. However, with a difference in 2024 Q3 revenue of just $12.5m between Penn and RSI, there is a chance this trend may not continue into 2025.
Gambling Insider delivers the latest industry news, in-depth features, and operator reviews that you can trust. Our team combines rigorous editorial standards with decades of specialized expertise to ensure accuracy and fairness. We are committed to delivering clear, impartial, and dependable coverage across the global gambling sector.
