Facing Facts: The corner of quarterly contemplation
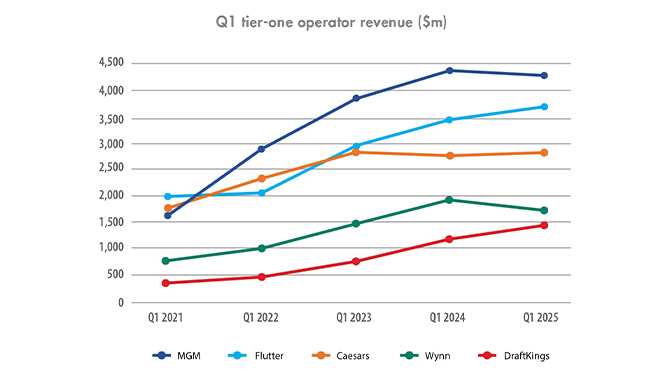
Major Q1 operator revenue ($m)Source: Company sites*Flutter Q1 results prior to Q1 2023 have been converted from £ based on conversion (accurate as of 13.05.2025 exchange rate)Across the board, both sportsbook operators and casino operators have seen growth in revenue since 2021. With Q1 2021 still being a period impacted by global lockdowns and Covid-19 measures, this is unsurprising.
MGM and Caesars, who operate land-based casinos as a primary revenue stream as well as online gaming services, see revenue relatively close to one another in 2021 – something again likely impacted by the Covid-19 pandemic. Wynn, meanwhile, which has a limited online presence yet a significant presence in Macau, fell significantly behind, outperformed by global sportsbook operator Flutter.
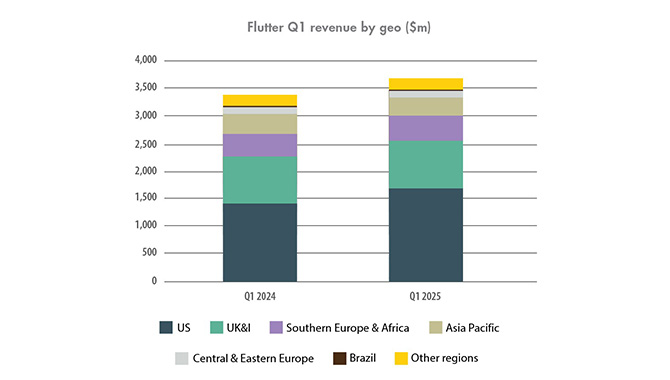
Flutter Q1 revenue by geo ($m)Source: FlutterAs of this latest reporting, all non-US segments have been compiled under Flutter’s International segment. This shifting focus towards the US is reflected in both recent Flutter business moves and the resulting split in earnings, with the operator exiting Euronext Dublin and making the New York Stock Exchange its primary listing.
Indeed, while UK&I revenue grew by just $21m year-on-year, US revenue was up by $256m, totalling $1.67bn. While the US segment has yet to earn more than half of Flutter’s revenue, with non-US revenue totalling $2bn, the trajectory of growth of this section compared to others suggests this may soon be the case. Asia Pacific, Brazil and other regions saw a decline in year-on-year revenue, with Asia Pacific seeing a notable decline, down from $358m in Q1 2024 to $313m in Q1 2025. Brazil’s revenue also took a dip, from $16m to $9m, though this may be attributable to the regulation of the market at the start of the year and subsequent fees and market competition.
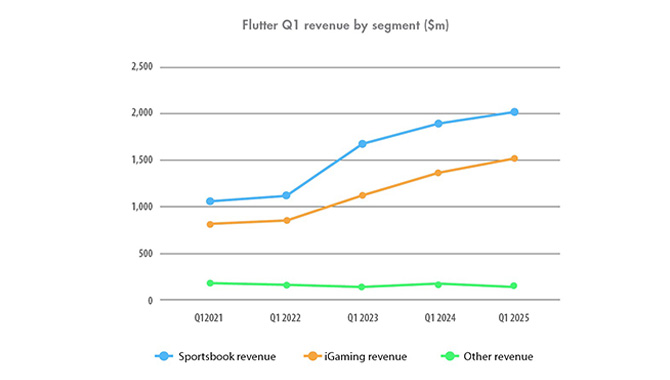
Flutter Q1 revenue by segment ($m)Source: FlutterWhile sports betting revenue continues to outperform iGaming revenue across its global operations, its trajectory of growth seems to be arching, with significant year-on-year growth between Q1 2022 and Q1 2023, but a slow-down from Q1 2023 onwards. Meanwhile, iGaming’s growth appears far more consistent, with the gap in revenue between the two segments seemingly getting smaller.
Other revenue sources have experienced a slow but steady decline over the past five years. A focus away from these products, in order to push high-earning sportsbook and iGaming products, may be to blame for this. However, given some of Flutter’s recent investments outside of sports betting and iGaming, such as its acquisition of Italian lottery brand Sisal and later of Italian iGaming brand Snai, these figures may see some level of revival.
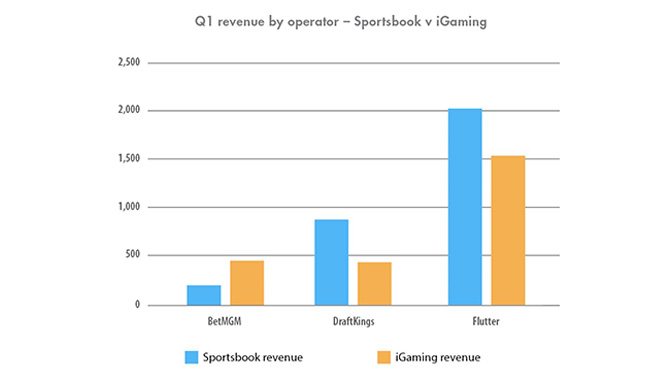
Q1 revenue by operator – Sportsbook v iGamingSource: Company sitesWhile DraftKings and Flutter both receive the majority of their revenue from sports betting operations, BetMGM bucks the trend by receiving the majority of its earnings from iGaming.
In the US specifically, DraftKings and Flutter’s US sportsbook, FanDuel, occupy the majority of market share. This can be seen clearly in New York’s April 2025 sports betting numbers, where of the $2.2bn handle, the two generated $727.4m and $822.5m respectively — over 70% of the total. BetMGM, meanwhile, reported handle of just $154.1m, or 7% of the total.
However, it is worth noting that, at present, only seven states offer legal iGaming; these being Michigan, West Virginia, Pennsylvania, Delaware, New Jersey, Rhode Island and Connecticut. If more states begin to offer iGaming options.
It is also worth noting that, despite their differences in overall revenue, BetMGM generated $20m more in Q1 iGaming revenue than DraftKings.
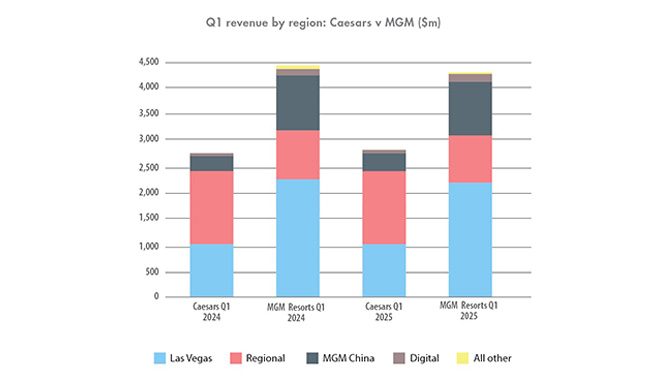
Q1 revenue by region: Caesars v MGM ($m)Source: Caesars, MGM Resorts International
While MGM Resorts primarily generates it revenue from its Las Vegas Strip operations, Caesars draws its revenue from its regional operations. Indeed, in Q1, MGM Resorts made $2.18bn from the Strip and $900.4m from regional operations, while Caesars made $1bn from its Vegas operations and $1.39bn from regional operations.
Caesars Digital also makes up a more significant portion of its revenue compared to MGM Digital, making $335m in Q1 2025 to MGM’s $128.1m. However, what puts MGM’s revenue so far ahead of Caesars’ is its MGM China operations. Macau frequently generates monthly revenue far greater than the Las Vegas Strip, having made $2.32bn in April 2025 compared to $1.3bn made by the state of Nevada. While MGM China did not outperform MGM Vegas operations in Q1 2025, it did outperform MGM regional operations, making $1.03bn compared to $900.4m from regional operations.
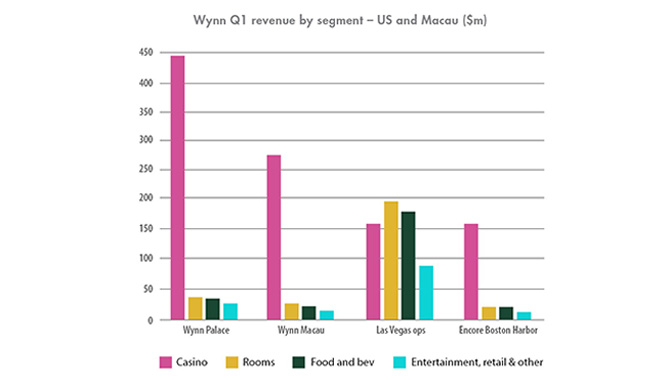
Wynn Q1 revenue by segment – US and Macau ($m)Source: Wynn Resorts
The Macau SAR Government initiated a diversity strategy in recent years to diversify revenue in the region beyond gaming. The 1+4 initiative includes development of the health, financial institutions and tech sectors, but has also encouraged gaming operators to engage in more non-gaming revenue sources, such as entertainment, food and drink and culture. Despite these efforts, non-gaming efforts at Wynn Palace and Wynn Macau remain fractional to casino revenue generated by the properties.
Vegas operations, meanwhile, show far more diversity in their revenue streams, with both rooms and food and beverage generating more in revenue in Q1 2025 than casino operations. Yet, Encore Boston Harbor shows a spread of earnings not too dissimilar to Wynn Palace of Wynn Macau, making the Vegas Strip something of an outlier in terms of funding sources.
Gambling Insider delivers the latest industry news, in-depth features, and operator reviews that you can trust. Our team combines rigorous editorial standards with decades of specialized expertise to ensure accuracy and fairness. We are committed to delivering clear, impartial, and dependable coverage across the global gambling sector.
