DraftKings, FanDuel Lean Into Prediction Markets on Q1 Earnings Calls; BetMGM, Penn, Caesars Forge Different Paths

Online gambling industry earnings in Q1 2026 revealed a strengthening tilt toward prediction markets and improving digital margins.
Digital-first companies such as DraftKings and Flutter are increasingly utilizing predictions verticals to target users in non-legal sports betting jurisdictions. The companies are also getting involved in market making on the exchanges, as they were eager to point out during Q1 2026 earnings calls.
A stark divergence has emerged between those online-focused companies and more traditional casino operators like Caesars, MGM and Penn Entertainment, which are so far avoiding the prediction markets space.
Here’s a round-up of what gambling companies said about prediction markets in their Q1 earnings reports.
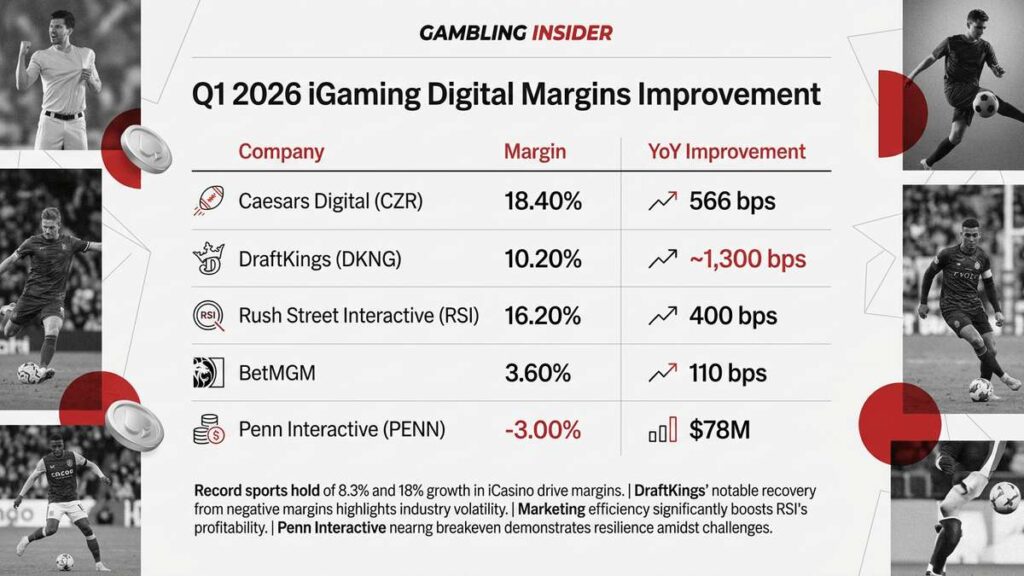
DraftKings (DKNG): 1,300 bps Digital Margin Expansion Driven By Prediction Markets
DraftKings is one of the online gambling companies leading the way in prediction market strategy. On its Q1 earnings call, leadership said that market making had already generated a positive return, describing the unit as among the fastest to profitability in the company’s history. Management is targeting a top-two/top-three market-maker position.
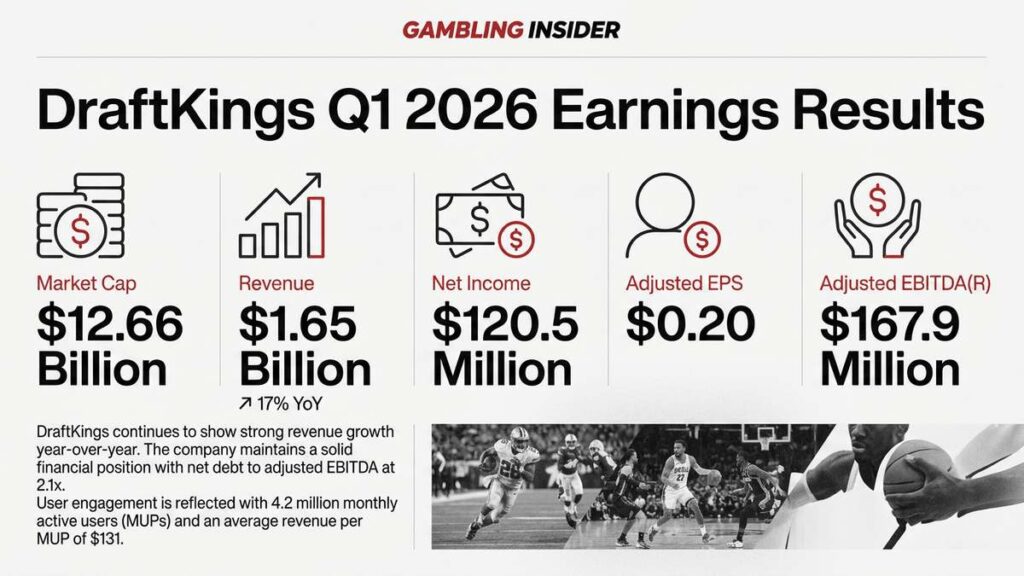
The company reported its first Q1 profit as a GAAP net income of $21.1 million, though adjusted EBITDA (a record $167.9 million) remains the management’s primary metric. In addition, DraftKings’ digital margins expanded 1,300 bps to 10.2%.
Commenting on the stellar contribution to performance by prediction markets, CEO Jason Robins said:
In April, our annualized predictions consumer volume exceeded $1 billion, and market-making is already generating a positive return for us, making it one of the fastest to profitability business lines we’ve ever launched.”
DraftKings financial metrics – Revenue $1.646 billion, +16.8% YoY; GAAP net income $21.1 million vs. net loss $33.9M; GAAP diluted EPS $0.03 vs. $(0.07). Non-GAAP adj. EBITDA $167.9 million vs. $102.6 million; adj. diluted EPS $0.20 vs. $0.12; MUPs 4.2 million, -4%; ARPMUP $131, +21%.
FACT-CHECK sources:
Official DraftKings earnings release
Full DraftKings earnings release report
Flutter (FLUT): Dual Strategy Implemented as Amy Howe Exits
UK-based Flutter, the owner of FanDuel, is also pursuing a dual strategy for prediction markets. On the one hand, it focuses on customer acquisition through FanDuel Predicts in non-sportsbook states, while on the other, it looks to market-making on third-party platforms.
This raises the danger of cannibalization, but says it has been limited so far, claiming that proprietary pricing will help unlock the market-making opportunity. The company’s market-making services started on the CME Group in April, and it expects to widen those activities to more third parties in the coming months.
The FanDuel Predicts app, launched in partnership with CME (see below), focuses on financial contracts, economic data, and event-based sports markets.
Although making progress, the firing of FanDuel CEO Amy Howe speaks to the pressures the US-facing sportsbook contends with from prediction markets, and its relatively lackluster response compared to DraftKings.
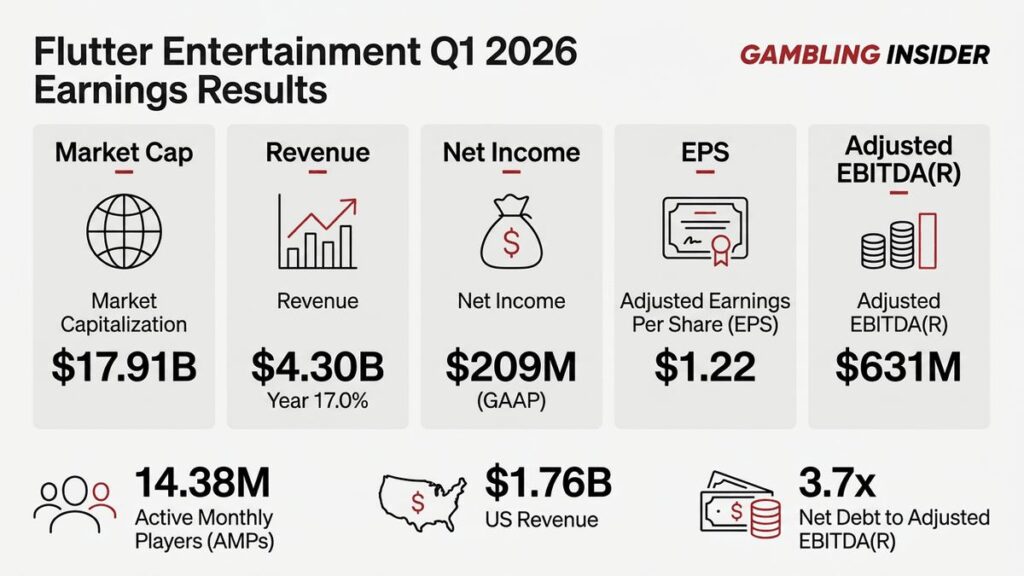
Flutter financial metrics – Revenue $4.304B, +17% YoY; GAAP net income $209 million, -38%; EPS $1.23, -22%; adjusted EPS $1.22, -23%; non-GAAP adj. EBITDA $631 million, +2%; adj. EBITDA margin 14.7%, down 210 bps; AMPs (average monthly players) 14.378 million, -3%; free cash flow $153 million, +74%; leverage ratio 3.7x. US revenue $1.763 billion, +6%; US adj. EBITDA $119 million, -26%.
FACT-CHECK sources:
Official Flutter earnings release
Full Flutter earnings release report
BetMGM: Playing Defense vs. Prediction Markets
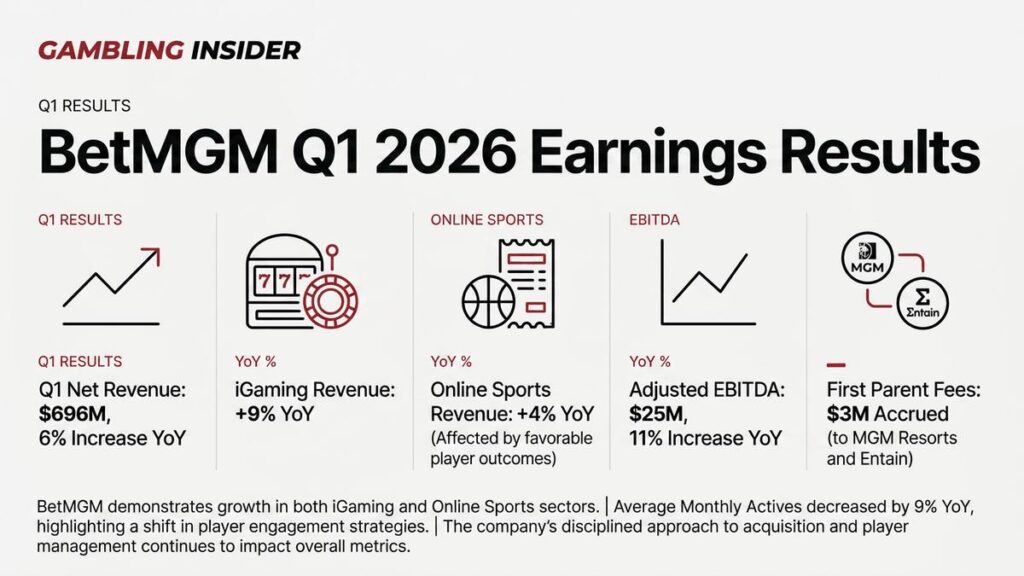
BetMGM EBITDA profit was $25 million, up from $22 million YoY, while revenue was up 6% at $696 million. The margin in the digital business was up 110 basis points to 3.8%.
BetMGM leadership is more defensive than favorable when it comes to the new opportunity presented by prediction markets, or to its thinking, threat. Management mentioned on the earnings call that prediction market firms were buying sports-betting keywords and media, increasing CPAs and targeting sports bettors.
Despite the threat, the leadership team remains of the opinion that BetMGM’s player economics and product proposition remain stronger for most recreational players.
MGM Resorts financial metrics – net revenues $4.5 billion, +4% YoY; GAAP net income attributable to MGM $125 million vs. $149M million; GAAP diluted EPS $0.48 vs. $0.51; adjusted EPS $0.49 vs. $0.69; consolidated adjusted EBITDA $580 million vs. $637 million. MGM Digital revenue $183 million, +43%; digital adjusted EBITDAR loss $26 million vs. $34 million loss.
Entain financial metrics – trading update, not full income statement. Constant-currency Group NGR +3% YoY; Online NGR +5%; Online gaming +9%; Online sports -1%. BetMGM Q1 net revenue $696 million, +6%; BetMGM adjusted EBITDA $25 million. FY26 online NGR guidance +5% to +7% reiterated.
BetMGM financial metrics – Q1 net revenue $696M (+6% YoY). iGaming net revenue +9% YoY; Online Sports net revenue +4% YoY, impacted by player-friendly sports outcomes and increased promotional generosity. Average Monthly Actives -9% YoY as expected, reflecting disciplined acquisition and player management. Adjusted EBITDA $25M (+11% YoY), with both iGaming and Online Sports delivering positive Contribution. First parent fees of $3M to MGM Resorts and Entain accrued in Q1.
FACT-CHECK sources:
Official BetMGM earnings release
Full BetMGM earnings release report
Penn Entertainment (PENN): From Sportsbook-First to Digital Entertainment Play
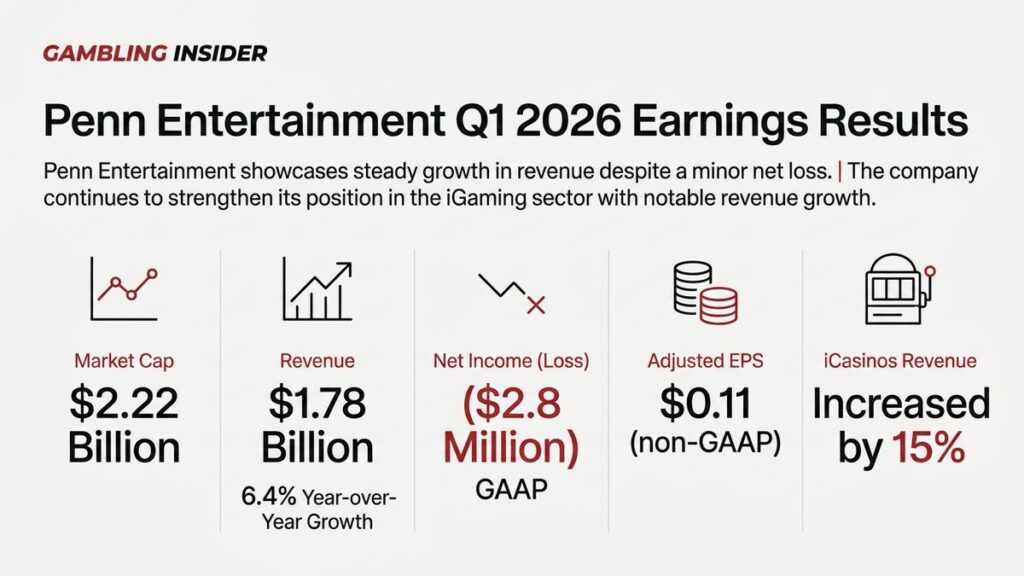
PENN Entertainment beat on its revenue and earnings expectations. Total revenue of $1.78 billion easily surpassed the consensus forecast of $1.75 billion.
The company is transitioning from being a sportsbook-first operator to a broader digital entertainment play. Its digital expansion strategy is defined by the positioning of theScore Bet brand in high-margin markets.
Unlike DraftKings and FanDuel, which are throwing themselves into the prediction markets vertical, Penn has eschewed that approach. Management is targeting the opening up of Alberta to legal sports betting on July 13 as the driver for near-term growth in its digital business.
PENN financial metrics – Revenue $1.779 billion, +6.4% YoY; GAAP net loss $2.8 million vs. net income $111.5 million; diluted EPS $(0.02) vs. $0.68; non-GAAP consolidated adjusted EBITDA $265.8 million vs. $173.3 million. Interactive revenue $358.3 million vs. $290.1 million; Interactive segment adjusted EBITDAR loss $10.8 million, improved from $89 million loss.
FACT-CHECK sources:
Official PENN earnings release
Full PENN earnings release report
Robinhood (HOOD), Interactive Brokers (IBKR), CME: Fintechs Having Different Prediction Market Experiences
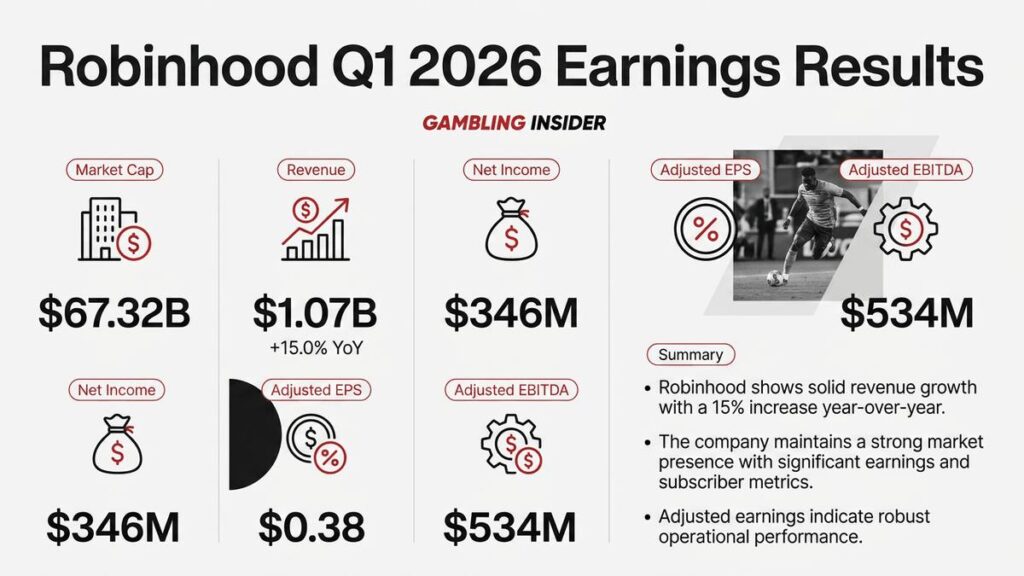
Robinhood is the standout prediction market revenue story of the quarter, as far as publicly-traded companies go (market leaders Kalshi and Polymarket are both private companies). The company says event contracts primarily drove the 320% YoY increase in “other transaction revenue” ($147 million).
On the Q1 results conference call, Robinhood was keen to talk up the firm as the largest retail brokerage in prediction markets.
At the center of its current ambitions is the launch of Rothera, its exchange joint venture (JV) with Susquehanna, later in the quarter as it sets out to vertically integrate beyond third-party exchanges.
Robinhood’s new event derivatives and election markets contributed to its record 27.4 million funded accounts. While Robinhood missed the consensus EPS of $0.41, 15% revenue growth was buoyed by high-margin prediction market trading.
While Interactive Brokers (IBKR) leadership during the Q1 earnings call in April framed prediction markets as a long-term opportunity, news broke this week that sports event contracts have been pulled from the company’s ForecastEx platform, becoming the first CFTC-registered exchange to do so.
In a Q&A with analysts, Chair Thomas Peterffy said ForecastEx was receiving more inquiries from firms that previously said they would not enter prediction markets, and described the category as potentially “a huge thing” with “a lot of prediction trading.”
In its Q1 earnings call CME (CME) highlighted that 30% of trading volume on its prediction market, operated in conjunction with FanDuel, has shifted to “market-based” contracts, such as equity, crypto, energy and metals, as opposed to sports.
Robinhood financial metrics – revenue $1.07 billion (+15% YoY); net income $346 million (+3% YoY); diluted EPS $0.38 (+3% YoY); adjusted EBITDA $534 million (+14% YoY). Prediction markets: transaction-based revenue was $623 million (+7%), driven by ‘other transaction revenue’ of $147 million (+320%), which was primarily event-contract revenue. Event-contract annualized revenue was approximately $415 million in Q1 2026, or around $445 million before contra revenue (deductions from sales), versus ~$435 million in Q4 2025.
FACT-CHECK sources:
Official Robinhood earnings release
Full Robinood earnings release report
Rush Street Interactive (RSI): iGaming’s Star Alpha Performer
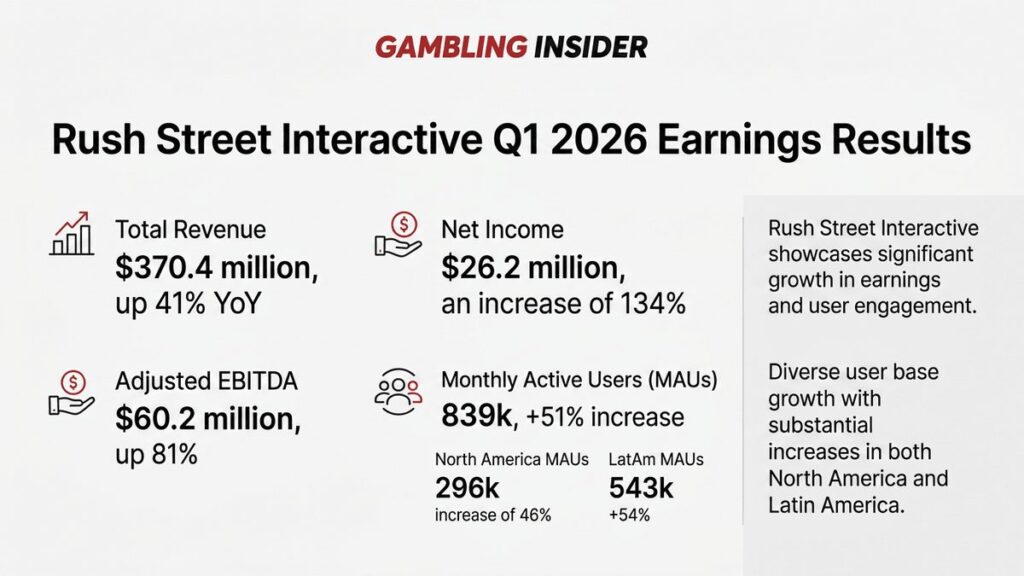
Rush Street Interactive (RSI) emerged as the sector’s alpha performer this quarter. Its net income jumped 134% to $26.2 million, and digital margin widened by 400 bps to an impressive 16.2% in the quarter.
While DraftKings and Flutter struggle with customer acquisition costs (CAC) in a maturing US market, RSI achieved a substantive $317 ARPMUP (Average Revenue per Monthly Unique Payer) in North America, nearly 2.5x higher than DraftKings ($131), proving its casino-first strategy captures a much higher-value user.
JPMorgan analyst Daniel Politzer noted that other digital gaming operators had reported rising costs per acquisition and slower user growth, attributing some of that pressure to the rise of prediction markets.
He and other analysts asked if RSI was seeing similar pressure or if “prediction companies” might become a larger threat as their technology matures. In response, CEO Richard Schwartz noted that prediction markets primarily focus on what he described as “event contracts” (sports, politics, and news events).
Schwartz stated:
Prediction markets today are primarily benefiting from sports event contracts, which is not an area of high priority for us. Our growth is being driven by our casino-first strategy, which caters to a different player profile.”
Rush Street financial metrics – Revenue $370.4 million, +41% YoY; net income $26.2 million, +134%; adjusted EBITDA $60.2 million, +81%; MAUs 839k, +51%; North America MAUs 296k, +46%; LatAm MAUs 543k, +54%.
FACT-CHECK sources:
Official Rush Street Interactive earnings release
Full Rush Street Interactive earnings release report
Caesars Entertainment (CZR)
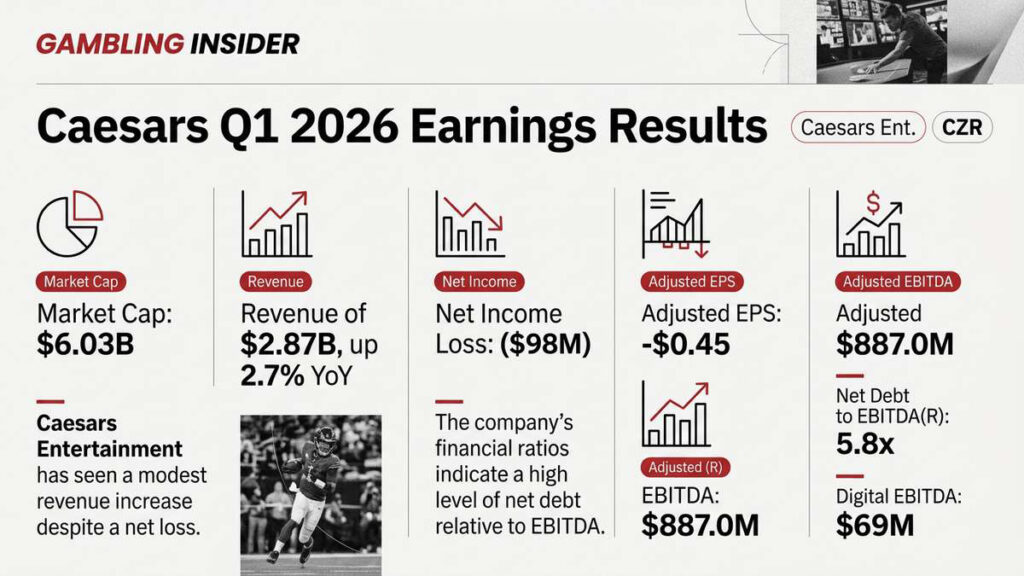
Caesars Entertainment produced record first-quarter revenue ($2.87 billion) and adjusted EBITDA ($887 million). Caesars addressed concerns about prediction markets’ impact on customer acquisition costs by emphasizing most of the company’s customer acquisition comes through its Rewards database.
“We’re not swimming in those same pools where prediction markets are making acquisition costs higher,” CEO Tom Reeg said.
Adjusted EBITDA for Caesars Digital was $69 million, up from $43 million for the year-ago period. Digital margin improved dramatically by 566 bps to 18.4%, driven by a record sports hold of 8.3% and 18% iCasino growth.
Regg added:
Caesars Digital’s revenue of $374 million and adjusted EBITDA of $69 million achieved record first quarter results… We continue to see a business capable of achieving 20% top-line revenue growth with 50% flow-through to EBITDA.”
Caesars financial metrics – Net revenues $2.870B (+2.7% YoY); GAAP net loss $98 million vs. $115 million loss; consolidated adjusted EBITDA $887 million vs. $884 million (+0.3% YoY); adjusted EBITDA margin 30.9%; Caesars Digital revenue $374 million (+11.6% YoY) and adjusted EBITDA $69 million vs. $43 million.
FACT-CHECK sources:
Official Caesars earnings release
Full Caesars earnings release report
Gambling Industry Earnings by Company: Q1 2026
| Company (Ticker) | Market Cap (USD) | Revenue (YoY) | Net Income / (Loss) | Adj. EPS | Adj. EBITDA(R) | Key Metric (MUPs / ARPMPU) | Net Debt to EBITDA(R) |
| Interactive Brokers (IBKR) | $113.7B | $1.67B (+17%) | $1.17B | $1.61 | N/A | ForecastEx: Volume up 24% | N/A |
| Robinhood (HOOD) | $67.3B | $1.07B (+15%) | $346M | $0.38 | $534M | Event Revenue: $147M (up 320%) | Net Cash |
| Las Vegas Sands (LVS) | $35.5B | $3.59B (+25%) | $641M | $0.91 | $1.42B | Macau Rev: Up 25% YoY | 2.5x |
| Flutter Ent. (FLUT) | $12.6B | $4.30B (+17%) | $209M (GAAP) | $1.22 | $631M | AMPs: 14.38M; iGaming: +28% | 3.7x |
| Evolution AB (EVO) | $11.8B | $603.8M (€513M) | $296.6M (€252M) | $1.48 | $394.6M (€335M) | EBITDA Margin: 65.4% | Net Cash |
| DraftKings (DKNG) | $12.7B | $1.65B (+17%) | $120.5M | $0.20 | $167.9M | MUPs: 4.2M; ARPMUP: $131 | 2.1x |
| Wynn Resorts (WYNN) | $11.4B | $1.86B (+9%) | $120.5M | $1.25 | $562.4M | Macau Rev: $989.2M (+14%) | 4.4x |
| MGM Resorts (MGM) | $9.5B | $4.45B (+4%) | $125.1M | $0.49 | $580.0M | Digital Margin: +1,285 bps | 3.1x |
| Light & Wonder (LNW) | $9.7B | $790M (+2%) | $52M (GAAP) | $0.66 | $327.0M | iGaming Rev: $91M (+18%) | 3.5x |
| Churchill Downs (CHDN) | $6.9B | $663M (+3%) | $83M (GAAP) | $1.21 | $257.0M | HRM Revenue: +$24M | 2.8x |
| Boyd Gaming (BYD) | $6.5B | $997.4M (+0.6%) | $105.5M | $1.60 | $317.4M | Midwest Growth: Favorable | 2.2x |
| Caesars Ent. (CZR) | $6.0B | $2.90B (+3%) | ($98M) (GAAP) | -$0.45 | $887.0M | Digital EBITDA: $69M | 5.8x |
| Entain PLC (ENT) | $5.2B | $696M* (+6%) | N/A | N/A | $258M (Est) | Online NGR: +5% | 3.2x |
| Rush Street (RSI) | $4.9B | $370.4M (+41%) | $26.2M | $0.14 | $60.2M | ARPMAU (NA): $317 | Net Cash |
| Sportradar (SRAD) | $3.2B | $408.3M (€347M) | ($7.1M) (€6M) | -$0.02 | $77.7M (€66M) | FCF: $51.8M (€44M) | Net Cash |
| Penn Ent. (PENN) | $2.1B | $1.40B (-20% vs Est) | $12M (GAAP) | $0.11 | $471.4M (Retail) | iCasino Revenue: +15% | 5.3x |
| Betsson AB (BETS) | $1.6B | $335.8M (€285M) | $30.0M (€25.5M) | $0.21 | $58.9M (€50M) | Actives: 1.5M (+11%) | Net Cash |
| Genius Sports (GENI) | $1.0B | $188M (+31%) | ($55M) (Loss) | -$0.21 | $24.0M | Retention: 108% (ex-IMG) | 4.1x |
Gambling Insider delivers the latest industry news, in-depth features, and operator reviews that you can trust. Our team combines rigorous editorial standards with decades of specialized expertise to ensure accuracy and fairness. We are committed to delivering clear, impartial, and dependable coverage across the global gambling sector.