Lies, damned lies and board reports
Industry veteran Kevin Dale offers tips to get the most out of revenue reporting in the boardroom

Even if you’ve had a shocking month, there’s always something to shout about. To avoid the probing of your revenue or customer metrics, you might selectively highlight the favourable results and downplay the rest. If all else fails, you emphasise progress in the product pipeline. After all, board meetings are supposed to be upbeat, growth-trumpeting, forward-looking affairs, aren’t they? Behind the bedroom door, a variation on the following conversation might play out:
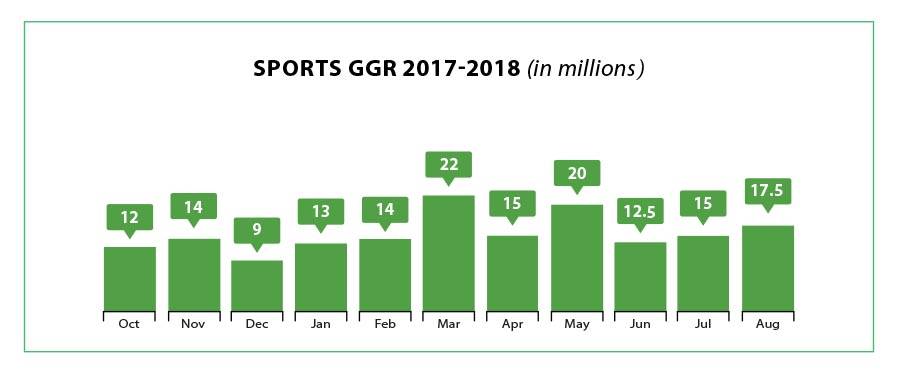
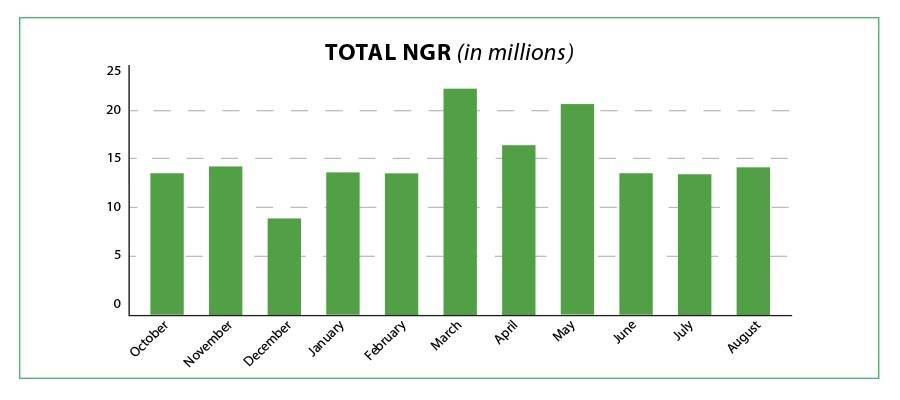
Director: “Great news folks, see page 1 of the board report. Gross gaming revenue (GGR) is up for the second month in a row.”
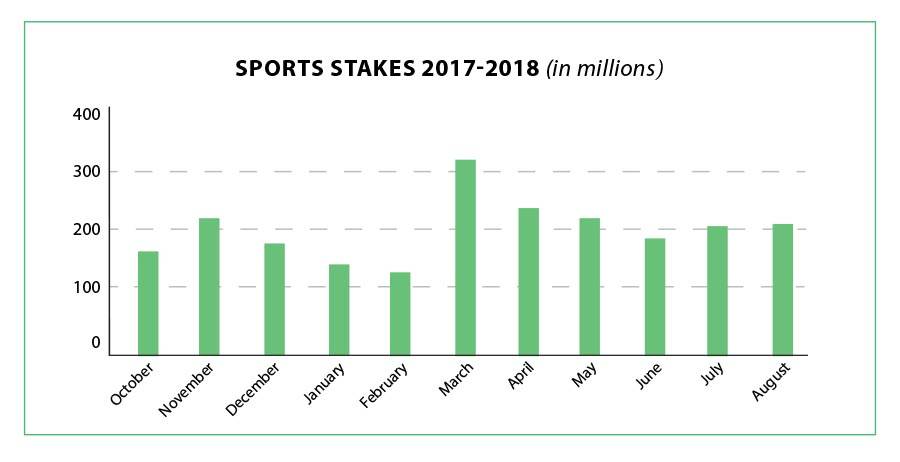
Board: “Yes, but looking at page 8, stakes don’t seem to have risen by anywhere near the same level as GGR. In fact, they’ve plateaued this last month.”
Director: “Not up so much, but still healthy and we have done very well on margin this month.”
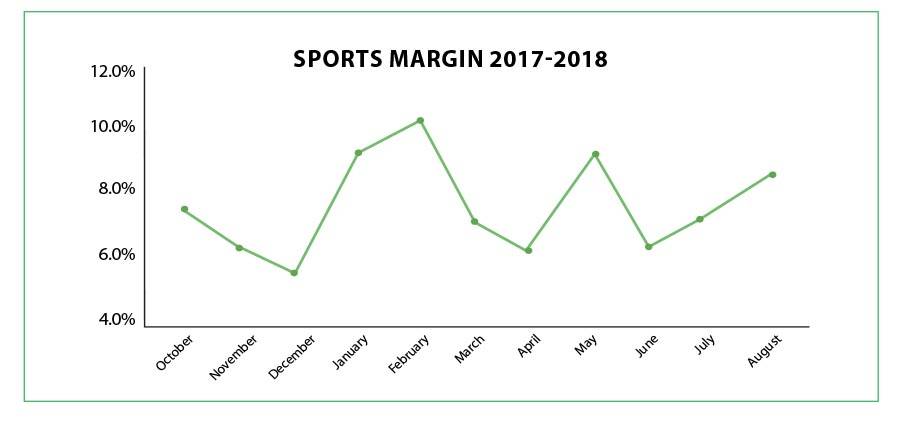
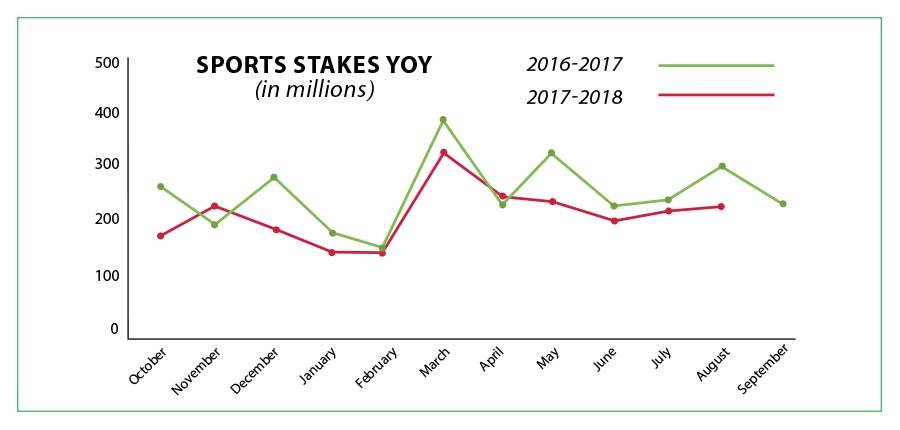
Board: “I’m not sure that results going in our favour is necessarily the same as us doing well. Look at page 4 in your Appendices – if I compare stakes to last year, this should have been a bumper month for us: the football season has just started and stakes are plenty down on the same month last year.”
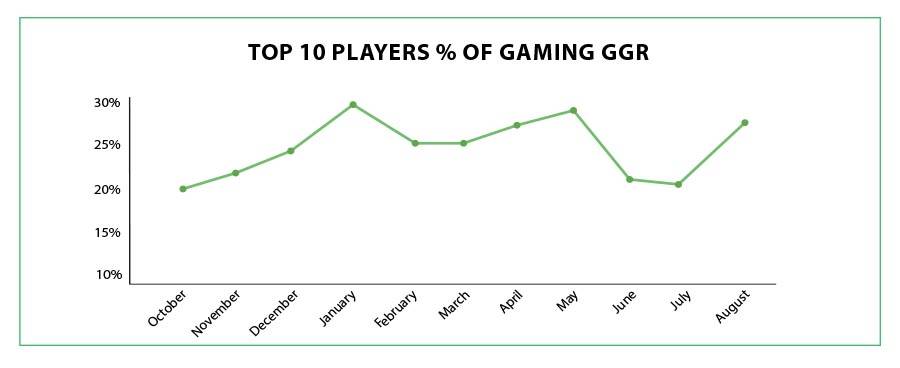
Director: “Ah, well we’ve been pricing our sports a bit higher recently because you were worried about our margin levels last time – that might have something to do with it. Also, on games margin, we launched 3D American roulette too with the double zero. This seems to be popular. Did you see the gaming margin improvement on page 2?”

Board: “I thought you said somewhere that gaming margin had improved because of the two new high rollers on blackjack
who dropped a fair bit with us. Besides, they’ve only taken our VIP business up to the levels it hit back in May.”
Director: “Yes, they play blackjack mostly, but also a bit of roulette. The new VIP rewards programme has been well received by all VIPs. Also, you mentioned last month we shouldn’t be over reliant on such a small number of users, so we’ve focused more on acquiring new players to reduce that dependence too. Did you see our new player acquisition numbers on page 2?”
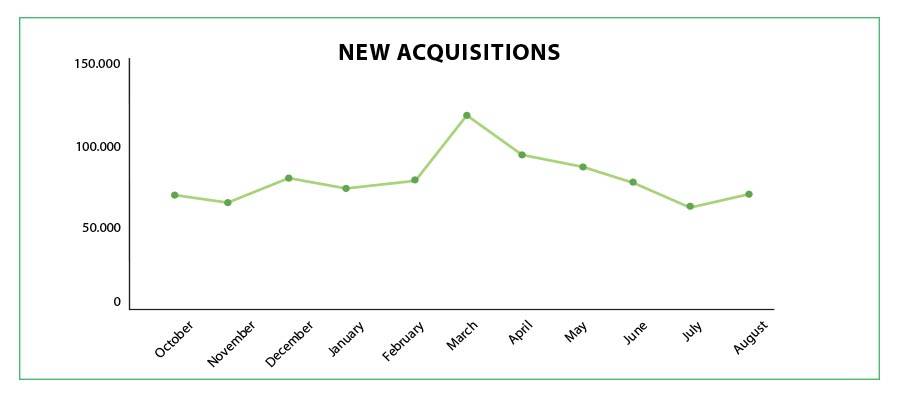
Board: “Yes, I did notice that and it is certainly a good sign, but I think some of your marketing costs seem to have
risen too. Am I right in saying net gaming revenue (NGR), i.e after bonus costs but before acquisition costs, hasn’t grown much in the last couple of months?”
Director: “Last month, we agreed to a big push for the new season and so invested quite heavily in our welcome offers. We do though believe this is money well spent. We should be able to retain the players nicely, especially with our new bet-builder product and the live casino we’re about to launch.”
Board: “The new products look great, but now that you mention it, how is retention tracking?”
Faced with some tricky numbers? We’ve all been there. A strategy of highlighting the positives while promising jam tomorrow is fairly common. Healthy GGR numbers might benefit from a temporary margin improvement one month, while a new-season boost could be your saving grace the next. But how do you survive the perfect storm of poor margin in the off-season, for example? Given the complexities of our business models, you could forgive the odd non-exec for glazing over midway through these results presentations.
But they’re not daft either. How long will it take your board to see through the smoke and mirrors? A positive approach isn’t necessarily wrong as such, but we shouldn’t delude ourselves in the process. It’s forgivable to distract from the weakest indicators, but not to ignore or misread them. We really do need to know why some of our metrics are looking a bit forlorn, but for that to happen, we first need to communicate them clearly.
Gaming results can be skewed by a whole number of factors and if we don’t filter these out, none of us will be any the wiser. Here are some tips below to help get you through revenue reporting.
1. NET OUT MARGIN VOLATILITY
Gaming is a unique sector in which financial performance is heavily influenced by chance and the volatility of results; much like our own customers’ ups and downs. A string of winning favourites, for example, is all it takes sometimes to transform what would otherwise be a healthy performance.
By presenting stakes and comparing these to GGR, we can net out part of the difference here. This is obvious maybe – but surprisingly uncommon. Margin is further complicated by the fact it is not only a function of player luck and sporting outcomes, but also our own
product and pricing strategies. If we really have made product mix, takeout or over-round changes recently, then normalise the data or map theoretical margins against those you achieve. Without stake reports and margin analysis, GGR reporting can be meaningless. Whether or not the board decide on optimal margin levels is a whole other issue.
2. BONUS COSTS
Similarly, any change to your bonusing and incentive offers can potentially make a bigger difference to NGR than any other factors. Tell the NGR story separately to the GGR one but with a good handle on promotional cost breakdowns and how they relate to acquisitions, conversion rates and retention levels.
3. SEASONALITY
You often see reports comparing revenues to the previous month and yet ours is a seasonal business. This is less so in gaming than in sports, but it’s still a factor, especially as sporting events are typically used for acquiring customers, who are then cross-sold into gaming products.
It might look good comparing results to the previous month a few times a year, but you have to ask yourself (before someone else does), what these comparisons really mean. Year-on-year charts tell a better story, but if last year’s numbers are a bit iffy, then benchmark your results against seasonal metrics for the industry. Better yet, my previous Chairman Nigel Payne insists on 12-month moving averages which flatten out seasonality completely – leaving nowhere to hide. If you’re not comparing apples to apples then, as certain as whoever made the little green things, we all end up confused.
4. HIGH ROLLERS
Whales are a key part of our ecosystem. They help justify the high acquisition costs we face and drive up revenues per user, or ARPUs; but they can also distort results. Enhance your board reports with VIP summaries, median and mode ARPUs, or present your results without the impact of VIPs – and not just when they’re winning. Whether you want to reduce the volatility of your VIP business though is a different issue again.
5. CONSUMER METRICS
Gross and net revenues are also intertwined with your customer metrics. There are a whole range of these you could present, but it shouldn’t be a case of cherry picking the best each month.
Acquisition numbers and costs (CPAs), active players, retention rates and ARPU all belong in every board report. If you know your business model well enough, you’ll also know a big spike in acquisition numbers will normally be accompanied by lower ARPUs in the same month.
First, they didn’t all join at the beginning of the month and second, your averages will be watered down by a higher proportion of
one-off visitors. Similarly, you’ll also know, for example, a spate of bonus abuse might flatter your acquisition numbers today, but you should be forewarning of an ARPU decline next month. By netting out the impact of margin, seasonality, bonus costs, VIPs and some customer metrics, monthly reports will start to make a bit more sense – not just for your board, but for you too.
Amid the quagmire of interdependencies, creative reporting only serves to invite doubt or forensic analysis. Ideally, we
should be completely familiar with our business model and be able to present the true picture, regardless of the ugly numbers that crop up. If you present it warts ‘n’ all, while setting out the plans to correct any issues identified, you’ll net the rewards.
Finally, pictures really do tell a thousand words, so serve up dashboards over spreadsheets every time. It speeds up the process of communicating performance. Imagine the conversation above without chart support, for example. Have a few extra charts at hand for the inevitable drill-down questions as to why that metric has gone south. Tell a clear story and don the rose-tinted specs by all means, but ditch the blinkers.
Kevin Dale has spent the last 20 years in digital business, including roles as CEO of Gameaccount Network (GAN plc), and Marketing Director of Eurobet, Sportingbet and Betfair.
Gambling Insider delivers the latest industry news, in-depth features, and operator reviews that you can trust. Our team combines rigorous editorial standards with decades of specialized expertise to ensure accuracy and fairness. We are committed to delivering clear, impartial, and dependable coverage across the global gambling sector.